


April 29, 2022

Folks, there is a massive sale on Wall Street but nobody is showing up. There is a market phenomenon that when the stock market goes on sale, everyone runs the other way. Of course, you need to own the right companies, but this is nothing more than a temporary resetting of prices before we head onward and upward. You must be patient through these difficult times- more on this subject later in the newsletter.
This brings me to being patient, or in my mom’s case, being a “patient.” Earlier this week, we had to rush my mother to the emergency room since she was experiencing intense pain. Not to share too much, but after arriving around 11 p.m. she did not see an ER doctor for over five hours and, in the end, all she received was one pain pill. You must be kidding me! This was the most unorganized mess I had ever seen. Nobody was in charge, as people who were deathly ill were left unattended for at least four hours before they left with nowhere to go and no one to help. We must be a more compassionate society. The executive director and other executives of that hospital should be forced to experience the same humiliation and lack of compassion. In my business and many others, we don’t go home until the job is done. If they can’t find help, why don’t these executives pull a shift or two and have a pinky’s worth of dignity to assist the staff?
The experience made me think of these poor immigrants crossing the southern border that are left out in the cold. How can our government allow such a travesty to happen in plain sight? Our health care system is currently overtaxed, and we are going to introduce millions of more people? I ask myself, what is to be gained by having millions of people who have given up everything to come to this country and have nowhere to go- no money, no job, no healthcare, and no roof over their head? We should throw all the bums out of Congress and start over again. Is this just for votes? Oh that’s right, it is an election year.
Now that Elon has bought Twitter, there is news this week that the Department of Homeland Security will focus on countering misinformation and disinformation. You must be joking! For God’s sake, what country do we live in? Wake up folks, the government is now going to decide what we can and cannot say! Remember when they said Hunter Biden’s laptop wasn’t real, and now look. Moving forward, you decide who we are: Russia, China, Cuba or Venezuela. Till next time, happy shopping.
Three Market Drivers

We focus on three market drivers that lead to notable movements in the stock market: economic fundamentals, technical environment, and investor sentiment.
Our fundamental indicator follows 19 economic datapoints that track the underlying health of the US economy. From unemployment to homebuilding, changes in these economic datapoints tend to confirm recession or recovery after the technical and sentiment indicators have already reversed.
Dynamic Asset Level Investing, or D.A.L.I., is a technical indicator that compares each of the major asset classes, sectors, and sizes and styles against each other to discover emerging trends in the market. D.A.L.I. compares daily price action of each of these elements on a point-and-figure chart to illustrate momentum. The chart at the bottom of this page shows the current leadership in D.A.L.I.
Our sentiment indicator tracks how everyday investors currently feel towards the U.S. economy and the stock market. Between our own polling and professional surveys like the American Association of Individual Investors (AAII) Investment Sentiment Survey and Citigroup’s Panic/Euphoria Model, we track the two most dangerous emotions for investors: fear and greed.
Here is a breakdown of where each market driver currently sits:
U.S. real GDP for the first quarter came in at –1.4%, which is the first negative quarter of growth since the COVID lockdowns. Eyes remain on the Fed to see whether they will stick to their original plan for raising rates, or if slowly economic growth will cause a new, dovish approach.
All three major indices (Dow Jones Industrial Average, S&P 500, and Nasdaq-100) are now below both their 200-day and 50-day moving averages. Until we see some semblance of these indices recapturing these moving averages, the trend for these indices remains negative.
The U.S. Index of Consumer Sentiment by the University of Michigan reported a level of 65.2 for April, which is a considerable rebound from the 11-year low of 59.4 from March. The index remains notably lower than last April’s level of 88.3.

GDP AND MEASURING ECONOMIC HEALTH

With unexpectedly negative real GDP (Gross Domestic Product) data being released yesterday morning, we have tangible evidence of the negative economic effects of inflation, supply chain disruption, and the Russian invasion of Ukraine. Today we’d like to look into what GDP actually is, and what components are involved in its calculation.
To put it simply, GDP is the value of everything produced within a country’s borders. By only considering what is produced within the country, it helps to avoid two countries double counting the same product. GDP is divided into four subcategories that include Personal Consumption, Business Investment, Government Spending, and Net Exports.
Personal Consumption makes up roughly two-thirds of U.S. GDP and is exactly as it sounds; it involves all the goods and services purchased. The goods involved in Personal Consumption include two types: durable and non-durable goods. Durable goods are goods that are meant to be a long-term investment and generally should last at least three years, like vehicles or home appliances. On the other hand, non-durable goods are much more temporary, such as food or fuel. Services are self-explanatory and include anything from financial services to healthcare.
Business Investment is the value of the purchases made to help to produce goods and services. Examples of these purchases manufacturing equipment and software created to assist in the creation of new goods and services. Business Investment also includes the construction of both residential and commercial real estate. Inventory levels are the last component of Business Investment, as companies will try their best to keep a healthy level of inventory on hand to meet consumer demand
Government Spending involves all federal, state, and local spending. On the federal level, this includes anything from programs such as Social Security and Medicare to defense spending. State and local levels can include more targeted investment into local infrastructure and schools.
Net Exports include the net difference of the amount of goods and services imported into the U.S. versus the amount of goods and services exported from the U.S. to other nations. Unsurprisingly, the U.S. is far and away the largest net importer in the world, even when accounting for the number of luxury goods produced and exported from the U.S.
By combining these four subcategories, economists are able to determine the health of the U.S. economy. Historically, economists have preferred GDP growth to remain between 2-to-3%, as this rate of growth (in theory) allows for continuous economic growth without the threat of inflation or asset bubbles appearing. On the other hand, negative GDP growth implies that the economy is beginning to contract. By definition, a recession occurs when GDP growth is negative for two consecutive quarters. With the knowledge of what goes into GDP, investors can strive to be better informed about what goes into measuring the health of the economy.
Market indices
Year-to-date returns
Large Cap indices
S&P 500: -10.04%
Dow Jones Industrial Average: -6.66%
Nasdaq-100: -17.55%
Mid and Small Cap indices
S&P 400 (Mid Cap): -9.57%
S&P 600: (Small Cap): -11.04%
Russell 2000: -14.58%
International indices
MSCI EAFE Developed Index: -13.85%
MSCI Emerging Markets: -14.46%
MSCI ACWI ex-US: -13.18%
Economic sector indices
Basic Materials: -4.38%
Communication Services: -23.22%
Consumer Discretionary: -16.05%
Consumer Staples: 3.49%
Energy: 38.84%
Financials: -8.63%
Healthcare: -5.29%
Industrials: -7.68%
Real Estate: -5.66%
Technology: -15.40%
Utilities: 2.58%
The Voting and Weighing Machines
In difficult market environments, it pays to have the mindset of a long-term investor. Famed investor Benjamin Graham is famously attributed with saying, “in the short-term, the stock market is a voting machine; in the long-term, it’s a weighing machine.” We’d like to explore what Graham meant by this, as well as how it applies to the current market environment.
A voting machine and weighing machine simply refer to what is driving current stock prices. A voting machine refers to short-term movements in the stock price, which can be driven by short-term reactions (both positive and negative) to temporary or one-time events. On the other hand, the weighing machine refers to long-term movements in the stock price, which is where investors should focus their attention. In the long run, stock price action depends less on their popularity and more on the substance of their company; by substance, this can refer to revenue growth, earnings growth, profitability, and other fundamental measures of a company.
Let’s look at a real-world example of the voting machine versus the weighing machine. In 2000, Jeff Bezos released a letter to all Amazon shareholders in which he addressed the stock’s recent price action. For context, Amazon’s stock price had risen 3,786% since it went public in 1997, clearly benefitting from the popularity of the “voting machine” during the Dot-Com craze. However, once internet companies began to crash, Amazon was now on the other side of the “voting machine”, with the stock price down over 80% at the time of Bezos’ writing. In the letter, Bezos mentions how Amazon’s fundamentals had improved in 2000: number of customers served had increased by 43%, revenue had increased by 68%, and gross profit had increased by 125% compared to 1999. Sure enough, a company like Amazon who had the fundamentals for the “weighing machine” to observe responded with strength following the Dot-Com Bubble.
While the Dot-Com Bubble may be a unique circumstance, significant drawdowns in stocks with quality fundamentals is a regular and healthy occurrence. In the table below, we looked back at the top five megacap tech names that make up FAAMG: Meta Platforms (Facebook), Apple, Amazon, Microsoft, and Alphabet (Google). We decided to observe the number of instances that each of these stocks had experienced a -20% or worse drawdown from its 52-week high. As you can see, these sizable drawdowns have been a relatively frequent occurrence in their history. In fact, Amazon investors have experienced a -20% or greater drawdown nearly every year in its 25-year history. However, even with these frequent drawdowns, Amazon has still averaged a historic annualized return of roughly 34%. When you look at the other companies, it is the same story: even with frequent sizable drawdowns, the upside performance has more than made up for these drawdowns due to their strong fundamentals. Even if uncomfortable, sizable drawdowns come with the territory of owning individual companies, which is why it is important to “weigh” how the underlying business is performing- buy and do your homework.
In drawdowns like the one we are currently experiencing, it is normal to see stocks across all asset classes correlate, regardless of how the underlying company is performing; in a market drawdown, the “voting machine” can deem all stocks as unpopular. It may be impossible to know which companies will be the next megacaps, but investors can still track the fundamentals of companies to try and find companies that the “weighing machine” will approve. In short, while it is important to track stock prices, they can be irrational in the short-term. To be a successful long-term investor, it is imperative to track the underlying business to ensure that the stock has substance underneath the surface. In simpler terms, long-term investors should watch the business- not the stock price.
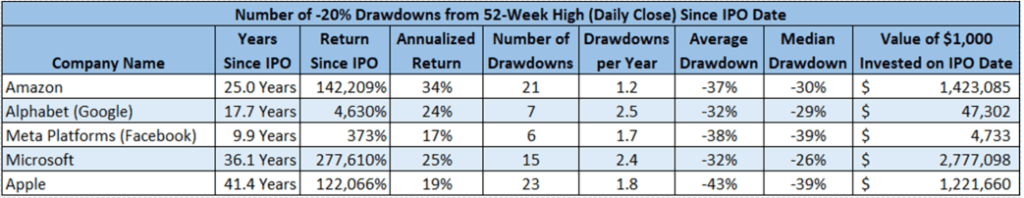
| Source: YCharts (data as of 4/26/2022) |

Chairvolotti Financial, Inc. dba 401karat is a Registered Investment Advisor.
